

Although logistics is still a very competitive landscape, the change from a demand-restricted market into a supply-restricted one over the last three years has caused a shift in the relationship between supplier and client. On top of that, the reliability of the logistics process has decreased, increasing the need for proactive, data-driven control.
In this paper, we discuss how effectively analysing and sharing data throughout the logistics value chain can enable clients of logistics services to strengthen their position among Logistics Service Providers (LSP’s) and related stakeholders, while securing superior service levels.
Based on a survey of over 400 supply chain professionals (Survey conducted in June 2022 among +400 users of customer portals in DSV’s Solutions division (Contract Logistics) in Europe and North America) and additional qualitative interviews with numerous shippers, logistics optimization experts and supply chain analysts, we have identified four key characteristics in companies that effectively analyse and share logistics data. As a result, companies with a superior bargaining position:
- Take more risk; they need a smaller safety margin, which allows them to take more calculated risks.
- Are more effective; it takes them less time and effort to identify problems and root causes.
- Anticipate; they can forecast future demand more accurately and secure availability of labour and inventory at the right price.
- Continuously improve; they monitor results in near real time and reiteratively review Service Level Agreements and tariff structures.
We elaborate on these four characteristics below, including a practical example of how each one strengthens data-driven bargaining power.
1. Take more risk
We often see that companies take a self-centred view in terms of the type and structure of the logistics data they share with LSPs and clients. Therefore, be aware that your product group classifications, subtotals, weight and volume buckets, service level descriptions and so on do not necessarily suit the organization you are sharing your data with. If you simply assume that the receiving organization will be able to disentangle your dataset and adapt it to their context, your clients and providers will build in additional safety margins since they will be unable to unleash the full potential of their data analysis tools. Instead, it is preferable to share a dataset that is as wide as possible at the lowest level of aggregation in a software-agnostic format. Don’t worry about the size of the dataset; today’s analytics tools are capable of handling many gigabits of data.
A Request for Quotation (RFQ) is a good example of when effective data sharing and subsequent analysis can positively influence your bargaining power. About half of all warehousing and distribution RFQs are based on randomly formatted Excel sheets and aggregated data, lacking key attributes. At each step of disaggregation, LSPs need to mitigate the risk and average the data and price in each assumption. This results in a quotation based on an average to worst-case scenario. Moreover, in view of the shortage of data scientists to crunch the data, the quality of the data provided in the RFQ is increasingly becoming a tender (dis)qualifier for LSPs.
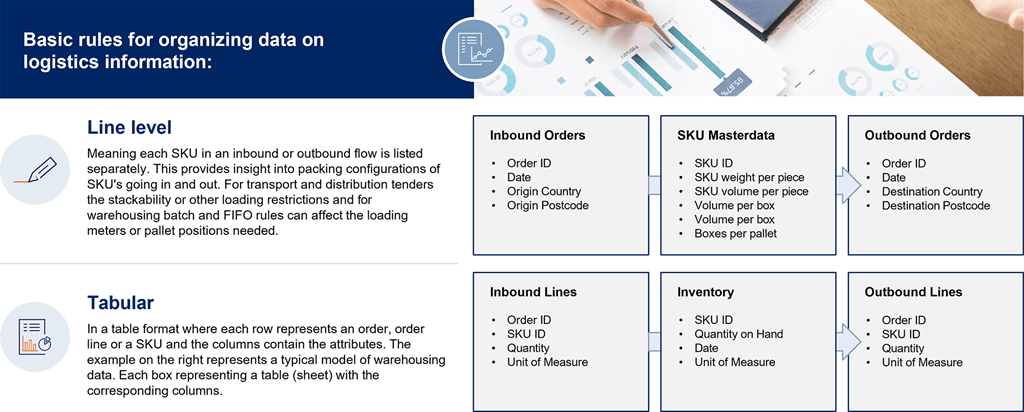 Best practice model for sharing logistics (warehousing) data
By making high-quality data available in their RFQs in the shape of clean, tabular, line-level datasets, shippers make it easier for the LSPs to analyse and accurately assess the risks, which leads to more competitive tariffs. This exercise also gives the LSP some valuable insights and helps them to recognize trends, bottlenecks and opportunities.
2. Be more effective
Imagine a situation in which the logistics cost for a certain product group skyrockets while the service level for another product group plummets. Imagine the discussion between the client and the provider. On both sides of the table, the first inclination is to assume that the other side is to blame. This is a good example of how sharing logistics data can make you more effective.
When each party in the logistics value chain uses its own data models with bespoke definitions, interpretations and reports, it is difficult to agree on a root cause. In contrast, having a shared set of reports, dashboards or a data mart facilitates joint root-cause analysis. Business intelligence technologies for sharing near-real-time data are advancing at an unbelievable pace. Against this backdrop, it is a missed opportunity if you are still exchanging CSV files with your clients and LSPs at the end of each month.
In an account management and operational context, sharing data and measuring performance based on the same data source enables a broader and deeper understanding of the logistics process. More confidence in data quality results in more trust between clients and LSPs. Having access to an extended range of metrics with a higher granularity will support faster action to resolve problems.
Ultimately, the pinnacle of effective data sharing is a standard set of key performance indicators (KPIs). These indicators should be:
1. Basic: Only built on data from the standard process so that the supplier can act on issues. Metrics like ‘% logistics costs per unit’ or ‘#Orders requiring value-added service’ can be useful internally but are not actionable by your suppliers.
2. Impactful: Covering a part of the process that directly impacts you or your client. While metrics like ‘Picking time per order’ or ‘#Deliveries per hour’ can give you some insight into the operational process, actioning them will not necessarily improve the service level.
 Overview of the most common logistics KPI’s
3. Anticipate
Based on the historical patterns and external trends, you can apply forecasting algorithms to predict volumes for the coming period, e.g. the next few weeks. In a regular Sales & Operations Planning (S&OP) process, all insights should be combined into a single forecast which forms the basis for all activities. The effectiveness of the logistics process depends on the accuracy of this forecast.
Analysing historical data reveals a lot about the volume patterns. You can plot planned and actual volume per customer, per destination and even at detailed level (such as product type or SKU). To gain insight into the volatility, it is necessary to include additional internal and/or external information to explore possible dependencies, e.g. information about promotional campaigns, weather conditions, contract changes and/or seasonal patterns. This information is also very relevant when reviewing the agreements in the customer contracts, such as minimum/maximum volume per week, average size, average distance, etc. Due to the influence of e-commerce and rising consumer expectations, there is a growing trend towards smaller order sizes and more frequent deliveries.
As an example, let’s look at anticipating labour requirements. We have seen various examples of the total overall workforce being sufficient, but the timing being wrong, leaving the company understaffed. Insufficient staffing results in stress, uncertainty and hassle to arrange additional labour. Additionally, an understanding of the labour requirement enables you to make arrangements with employment agencies for temporary workers at a much earlier stage at more favourable costs. This creates a much smoother supply chain and improves employee satisfaction, especially if personal preferences can also be incorporated into the workforce scheduling system. Effective workforce planning puts you in control of the workforce; and employment agencies will be required to adapt to your scheduling system rather than the other way around.
 Example workforce planning process
4. Continuously improve
The final step for using data is during execution. Many companies are using a Control Tower to accurately monitor their logistics. It directly issues alerts if things are moving slower (or faster) than anticipated. Interventions can be automated based on pre-agreed business rules in the software. This enables the logistics manager to focus on the exceptions rather than the routine tasks. The Control Tower also provides insights to other stakeholders, such as to inform the recipients when orders will arrive so that they can optimize their part of the supply chain accordingly. Similarly, a Control Tower supports the monitoring of suppliers, Service Level Agreements and tariffs. This not only helps customers and suppliers to reach better contractual agreements based on actual performance, but also facilitates continuous evaluation and improvement of the internal operation.
Data lakes containing operational data allow the use of state-of-the-art tools to analyse the data, to search for characteristics and dependencies, and to use the resulting insights to continuously improve the operations. A loop of continuous improvement applies the learnings from historical data. The application of machine learning makes it possible to assign all the tasks and activities at a detailed level to products, orders, customers and recipients. This can then be used to calculate the costs and revenues for each activity and, as a result, to conclude whether products, customers and recipients are profitable or loss-making. This data puts sales and account managers in a strong position during tenders and contract reviews.
 Loop of continuous improvement during execution
The analytics advantage
Companies leading in applying analytics in the logistics chain have a relatively better bargaining position. Many companies are aware of the importance of data and have at least some level of maturity in analytics. The bottleneck to achieve many of the analytics advantages in the logistics value chain described is pushing these analytics capabilities from IT and BI departments towards business roles such as supply chain, purchasing and sales/account management. Customer and provider facing roles must become more analytical. Sales, purchasing and account management processes more data driven.
This paper shows that using data analytics improves a company’s risk management, its effectiveness, ability to anticipate and focus on continuous improvement. This leads to benefits for all stakeholders in the logistics value chain. If you create the right culture, vision and ownership at leadership level, the second step is to reach out to your providers and clients in the logistics chain and prioritize data sharing, data quality and analytics on the agenda.
For more information about taking this first step to leverage the power of data analytics in your logistics value chain, feel free to contact us.
About the experts
 Goos Kant
Goos Kant (1967) is Managing Partner at ORTEC a global supplier of mathematical optimization software and advanced analytics. Next to this, Goos is part-time full professor at Tilburg University and JADS (Jheronimus Academy of Data Science) in Den Bosch, The Netherlands. Goos specializes in data science and logistic optimization.
 Thomas van Vliet
Thomas van Vliet (1975) is Director Business Analytics at DSV, an industry leading logistics service provider. Thomas builds on his 25 years of experience in logistics to deploy industry-relevant business intelligence solutions. His current role focusses on developing data-based services for DSV’s contract logistics clients worldwide.
Would you like to learn more?
Our experts are ready to help. Get in touch and we'll find the solution you need.